Economics

Home Economics

“Drill, baby drill” Trump will flop

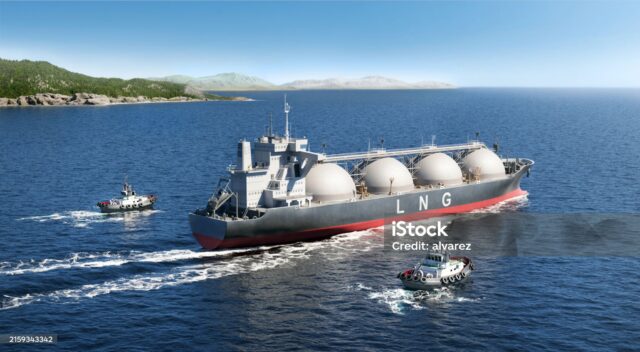
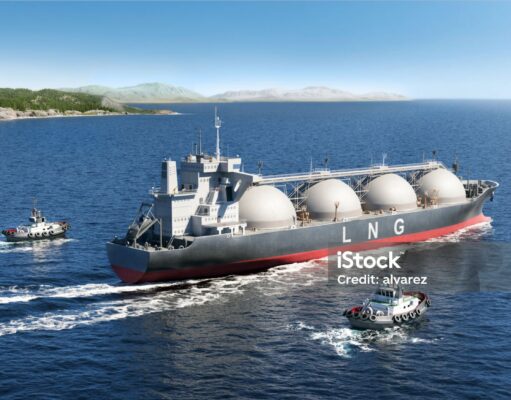
LNG export terminal

Introduction

The current oil and gas gluts and planned expansion projects will hit walls as demand around the world for fossil fuels is already on trajectories to decline.

China, the largest importer of fossil fuels, is engaged in a transition to a green economy at such a humongous pace, it is difficult to keep up with developments.

Too, China’s affordable electric vehicle (EV) global sales are on launching pads to take the world by a storm, leaving the U.S. to become a dinosaur.

U.S domestic power trends favour renewables over natural gas.

South and Southeast Asia, perceived by the liquified natural gas (LNG) industry as the next hot markets, are turning to renewables.

Lastly, Europe, South Korea and Japan, half the global LNG market, are engaged in a transition away from fossil fuels. 

Fossil fuels glut

Oil

According to the International Energy Agency, oil production will outstrip demand from now until at least 2030.  Two principal factors point in this direction.

First, growth in oil demand in Asia, aviation and petrochemicals will be more than offset by a decline in demand associated with transportation sector electrification and better fuel efficiency plus the climate action of critical fossil fuel importing jurisdictions, most notably in China and Europe, along with other countries.  More on the climate achievements and momentum of these jurisdictions follow in subsequent article segments.

Second, Guyana, Brazil and Argentina are increasing their supplies to global markets.

Hence, Trump is his worst enemy by encouraging expansion of U.S. oil production.

This could be exacerbated by a pending price war with Saudi Arabia.

For the U.S., the bottom line is the oversupply has contributed to the current price of oil, around $70/barrel, too low for U.S. expansion.  The U.S. oil industry is hesitant to expand, and more focused on shareholder returns.

For U.S. oil production to expand, the price must rise to $80 or more, becoming more unlikely due to the indefinitely long global glut.

Natural Gas

There’s already a natural gas glut, as per the conclusions of the for Institute Energy Economics and Financial Analysis (IEEFA).  This glut will get much worse, very much the result of the U.S. massive natural gas expansion projects.

Globally, the LNG supply capacity may increase to 666.5 million tonnes per annum (MTPA) by 2028. That’s greater than the IEA assessment of demand prospects for 2050, 482 MTPA.

The U.S has about 20 new LNG project terminal projects, with 4,667 km of pipelines.  If pending applications are combined with the 360 MTPA of approved projects and added to current production, the U.S. would be on a path to produced 430 MTPA of natural gas, by 2029 to 2035.

This would far exceed the current global capacity of 400 MTPA.

The U.S. expansion projects and the European gas import substitutes, post Russian invasion of Ukraine, have driven up the international price of natural gas and U.S. domestic power rates as a side-effect.

In January 2024, Biden had tried to put a temporary pause on pending LNG-related projects.  One year later,  in January 2025, Trump ordered resuming reviewal of applications for pending projects.

Trump chose to ignore the implications of increasing U.S. gas exports.

Even current capacity alone indicates there will be costly stranded assets before 2030.  Quite the risks, given the price tags of large export terminals are $15 to $25 billion, the lifespan of a export terminal is 30 to 50 years, and import terminals cost around $3 billion.

There are also the obstacles to the financing of long timelines for building LNG related infrastructures. Terminal construction can take from just under 4 to 5.1 years.

For an idea of the expenditures for pipelines, 13 of them adds up to more than $62 billion.

Further, the poor economics of the U.S. natural gas sector demise is already evident. While U.S. natural gas supplies are 78% shale gas, 30% to 40% being by-products from shale oil sites, the more productive/profitable shale U.S. oil and gas wells have been depleted. Since shale gas wells have a productive life duration of 3 years, the industry looks like its heading for another financial conundrum, a repeat of the shale industry meltdown in early 2020s.

Swelling the global supply situation, Norway, Russia, Congo, Gabon, Nigeria, and potentially Mozambique and Tanzania, are, and/or my soon be, contributing to more gas supplies on global markets.

The gas export stakeholders continue to pin hopes for larger LNG supplies to supply new markets in South and Southeast Asia,  To serve the power needs of these markets, home-grown renewables projects are the better options since they are relatively inexpensive, and construction timelines are short.

Significant, China has its own shale gas potential.  Together with China’s goal severance from fossil fuels dependencies, this will lessen the need for LNG imports.  It is estimated that China has 31.57 trillion cubic metres (1,115 trillion cubic feet) of recoverable shale gas.

Eventually, the global gas oversupply bottom line will lead to lower prices, something that threatens the viability of the U.S. shale gas sector.  These lower prices will likely last for quite some time.

Green transition is well-underway

China’s oil and gas imports decline

China, the world’s largest energy consumer, representing 25% of global oil imports and 18% of global LNG imports, is weaning off oil and gas at spellbinding rates.

China is the most electrified nation in the world and the pace of electrification continues to spiral.

No wonder, the peaks of China’s crude oil consumption and refined oil are 2025 and were 2023 respectively.  Crude oil imports declined 2% in January 2025.  By 2035, China’s refined oil products consumption is projected to drop 25-40%, based on the peak year 2023.

On natural gas, though China is the largest importer of gas in the world, consumption and emissions are destined to drop through to 2030, because gas is more expensive than coal and not green; wind and solar total capacity to-date have exceeded China’s target; coal capacity is used primarily for peaking periods; there has been a shift to supercritical coal power plants with less emissions than traditional coal facilities; and, most important, China has an overarching goal for a peak emissions deadline with an emphasis on energy independence.

China’s EVs domestic and global market expansion:

In 2024, China’s affordable and advanced tech EVs captured 60% of the global EV market, 53% of its domestic vehicle market.

Chinese EV manufacturers are now poised to conquer ALL major global markets outside North America.  The BYD momentum to-date entails manufacturing plants and projects in 7 countries and entering a new country nearly every week, with an average selling price of $16,700.

Concurrently, legacy automakers, for which China is a major market, are losing market share in the country, because they cannot compete with China’s EV’s which have better designs, prices and technologies.

The EV Trump effect

The Trump administration wants to stop attacks on gas-powered vehicles

Contributing to the demise of North American-based legacy automakers, Trump’s plan is to roll back corporate average fuel economy standards from the 2025 level to that of 2019.

The reversal on vehicle emissions will result in 25% more emissions/vehicle mile than current 2025 rules and an average fuel economy dip of 15%.  The brakes have been put on the transition to EVs.

The Trump package would also prohibit California and 13 other waiver states to adopt stricter emission rules than those of the federal government, beginning 2026.   During his first term, Trump had blocked waivers of the previous administration, but the Biden unblocked this restriction.

As for Musk, he  believes the termination of EV consumer credit will hurt Tesla’s competitors more than Tesla.  Ford claims it loses $100,000 per EV sold and EV-related 2024 loses will be well over $5 billion.

Accordingly, the Trump administration has sent clear signals to legacy automakers in U.S market to change priorities to favour lineups of more of the more profitable gas guzzlers.

The U.S. EV market share will not come close to the Bloomberg projection of 13% for 2024 or the IEA prediction of 11%.

EVs, the U.S. aside

Notwithstanding Trump’s undermining the EV sector in the U.S., by 2030, the global EV fleet will displace 3.3 million b/d (b/d) by 2030, up from 385,000 b/d in 2022.

China, renewables and keeping pace with rising electricity demand

China’s renewables have reached 50% its power supply with the installation of 357 GW of solar and wind in 2024, an 18% increase from the previous year.

The result is China’s renewables target for 1.2 TW by 2030 was reached in 2024, 6 years ahead of schedule.

Yet these achievements have not been enough since China’s electricity demand has risen faster than the economic growth since 2020.  The country’s electricity demand increased 7% in 2024, and the forecast is for an annual average of 6% through to 2027.  In addition to the electricity consumption growth associated with the manufacturing of clean tech and energy intensive industrial sectors, there are new phenomena, such as the latest highs in consumption for air conditioning and 5G networks.

The U.S and renewables

Most inconsistent with Trump’s view for America, 93% of 2024 power capacity additions stemmed from clean energy.  U.S. solar set a record in 2024, at 30 gigawatts (GW), accounting for 61% of U.S. utility scale power capacity additions for the year.

And the U.S. Energy Information Administration (EIA) predicts 2025 solar new capacity will reach 32.5 GW.  That’s far less than the 2025 EIA projection for gas at 4.4 GW of added annual capacity and lower than wind for this year at 7.7 GW.

U.S. solar additions combined with energy storage, will come to 81% of U.S. of 2025 capacity additions.

Interesting, Texas is the U.S. windpower leader and its solar sector is booming, 11.6 GW estimated for 2025.

The other 50% of global LNG markets

Elsewhere, the combined LNG imports of Japan, Europe and South Korea, which account for half of LNG demand, declined in 2023.  The descent is expected to continue through to 2030.

European gas imports were down 20% in 2024 and consumption is expected to peak in 2025.  EU gas imports trajectory is expected to continue to decline through to 2030.

Japan previously the world’s largest LNG importer, is another country where imports of gas are descending, 8% in 2023, another 9% in 2024.  Increases in nuclear and renewables capacity will assure continuation of the gas use tumble.  Since 2018, LNG imports fell 20%.

For South Korea, traditionally the largest importer of U.S. LNG, imports dropped 5% in 2023. With the planned increases in solar, wind and nuclear capacity, by 2035, LNG imports may drop by 20%.

In Southeast Asia, LNG projects are on pause with significant transitions to renewables underway, especially in Vietnam and the Philippines.

In South Asia, Pakistan proclaimed a halt to LNG projects while engaging in a radical transition to renewables.  During the last two years Pakistan installed 40 GW  of solar, extraordinary since its entire power generation capacity in 2023 was 46 GW. This profound departure from past energy policies may soon get a big boost, to the tune of $1billion in climate funds, from the International Monetary Fund.

India, like Pakistan, has no plans for plans for new LNG plants.

This spells trouble for U.S. export contracts which typically integrate flexibility for the termination of shipments.

In Canada, most of the LNG projects have been shelved, the results of high cost for terminal construction and pipelines along with public political opposition to new projects.

The takeaway

It is clear that the current oil and gas gluts will get worse with demand for fossil fuels at the precipice of a global decline.

China alone, the world’s largest energy consumer, is engaged in a mindboggling rate of electrification and decarbonization of its economy.  This will significantly reduce global fossil fuel demand, peak oil has already been reached and peak gas very soon.

China’s affordable EVs are penetrating global markets, leaving the U.S., and probably Canada, way behind in road transportation. Road transportation traditionally represents 25% of petroleum consumption.

Renewables around the globe are displacing natural gas demand.

This is even happening in the U.S, where 93% of new capacity in 2024 was attributable to renewables.  Solar and energy storage combined, will come in at over 80% of power additions in 2025.

South and Southeast Asia emerging economies are engaged in a transition to renewables.  Thus the prospects for bets on the LNG industry exports are fiction.

Ditto for South Korea LNG demand.

The European momentum on renewables, EVs, heat pumps and other decarbonization measures, are unstoppable.

Better technology at better prices are globally agnostic, as such, cannot be stopped by the phantasms of the President of the U.S.

The world is already engaged in the energy transition and all the new economic paradigms that go with it.

The Trump drill baby drill objective will flop globally and domestically.

AI + Data centres: Slop, debt + fossil fuels

Young smiling woman portrait silhouette with AI brain hologram hud, double exposure chip with digital lines, copy space white background. Concept of artificial intelligence and technology

Intro

The prime catalyst for AI data centres growth is Trump’s fetish for such centres.

The global IT capacity of data centres under construction represented 23 gigawatts (GW) by September 2025, 75% of this capacity is in the U.S.

For 2028, the energy impact is estimated to be around 6.7% to 12% of electricity U.S. demand dedicated to data centres.

Seven companies, dominate U.S. data centres landscape, Alphabet, Amazon, Apple, Meta, Tesla, Microsoft and Nvidia.

The exponential race to build U.S. data centres is

Much of content produced is slop.  The word “slop” is a recognized word in the Merriam-Webster English dictionary for “digital content of low quality that is produced usually in quantity by means of artificial intelligence.”

The bubble

Globally, 23.1 GW of capacity is under construction at 831 sites, the Americas accounting for 17.1 GW over 311 locations.  For the Asia Pacific region, it’s 3.2 GW over 283 sites and Europe Middle East and Africa, 2.8 GW across 258 sites.

Private equity and subsidized debt financing are the pillars for continuous growth of U.S. data centres.

In the U.S., nearly 100% of AI investments in data centres comes from subsidized private equity and debt financing.  These centres have yet to prove they are profitable. This model can only work if there is infinite growth.  The vast amounts of debt incurred for data centres has created an inflated bubble which would burst if the growth stopped.

Large global banks and Wall Street are concerned about the speculative nature of these investments.

As well, since chips and servers evolve, there is built in planned obsolescence.

In 2025, in Pennsylvania alone, the Trump administration and the state have announced $100 billion in investments to accomodate data centres.  This includes $1 billion for the restart of Three Mile Island nuclear facilities, left idle for 3 decades,  to supply Microsoft and other data centres in the state.  Another $20 billion was committed from Amazon, Google, Westinghouse, Meta and others.

Slop: Poor quality AI answers

Only half of AI pattern produced packaged answers are credible.  For the rest, AI invents wrong answers and/or uses dated content when it has no idea of the right answers.

Israel’s Lavender and Gospel projects used predefined autonomous data matching sets and sensor information from all sorts of systems, eg cell phone data and social media, to target “potential” Hamas combatants.  These algorithms are prone to getting it wrong, but Israel’s military forces applied it for the machines to learn to make decisions, nothing to do with human intelligence and integrity. This intelligence was responsible for Gaza genocide 72,551 deaths and 39,000 children being orphaned, losing, and/or separated from, one or both parents.

The backbone for the pattern matching is the product of slave-like workers reviewing thousands of data sets in poor countries.  For this work, the average pay is $2/hour.

Social economic impacts

Microsoft CEO Satya Nadella argues that the AI data centres will contribute to major productivity gains which will deliver economic growth  Hence, data centre sector will expand indefinitely.

But 95% of surveyed businesses using AI claim AI makes no difference on returns.  AI benefits have primarily been applied to sales and marketing pilots.

Most of the jobs that come with new data centres pertain to the construction of the humongous sites.  But once constructed, there are not many jobs, apart from maintenance and operation.

Also, typically, a data centre consumes 1.14 million litres of water/day for cooling purposes, but large data centres can consume up to 19 million litres of water/day.  Collectively, data centres in the U.S. will consume 13.8 million litres of water by 2028, equivalent to the needs of 360,000 households

Two-thirds of the U.S. data centres to-date are in water-stressed states, among them Arizona, Texas, Nevada, and the Colorado River Basin.

Decision-making on U.S. data centre projects usually bypass local governments, leaving it to regional and national governments.  The hasty pace for approvals by the companies concerned entails risks, environmental degradation coupled with a lack of time for defining new regulations.

If the local utility energy must expand its infrastructure quickly, the result is either higher utility rates or fossil fuel alternatives.

The centres are often planned for rural communities, because of the amount of land required for these centres.  This often results in a total rupture of the way of life of inhabitants of such regions. Taking precedence is Trump’s AI fetish belief that state legislatures cannot sideline AI projects.

For example, Digital 1/PAX-1 is one rural data centre data centre planned for Pennsylvania, which will cover nearly 300 hectares – the size of 80 American football fields.

This project involves a $15 billion investment that would supposedly create 450 jobs and generate $65 billion in tax revenues.

A grassroots Pennsylvania organization, Protect PT, struggles to rally opposition to these investments.

Meta’s $7 billion data centre in Michigan, Saline Township, near Ann Arbour, was rejected by local authorities.  This was taken to court which reversed the Township rejection.

The small town of Archibald, Pennsylvania, population 5,400, is the location envisioned for 5 data centres requiring 1.2 million square metres (13.4 million square feet).

Similarly, Project Sail, comprises a planned 900 MW  data centre of 336 hectares (830 acres) centre in Georgia, equivalent to 600 football fields, in Newnan, 56 km (35 miles) just south of Atlanta.

Another Georgia project, the Coweta County Council endorsed rezoning for Project Peach a large-scale data center being developed by Dallas-based CyrusOne in the town of Palmetto, about 24 km (15 miles) northeast of the Project Sail site.

For both of these Georgia projects, the Trump administration exercised pressure to fast-track the projects, even offering public-private partnerships.

Citizen resistance in other countries include the Chile, MOSACAT  (Community Movement for Water and Land)) engaged in a legal battle since 2019 to stop a proposed construction of a hyperscale Google data centre in Cerillos, outside Santiago. After years of protests and organizing spearheaded by MOSACAT’s Tania Rodriguéz, in February 2024, a local court halted the project, demanding that Google revise its plans so that they take into account the intense water consumption and Chile’s significant droughts.

In Ireland, deregulation and fossil fuel development to accommodate these centres are making a comeback.

Not surprisingly, Microsoft CEO Satya Nadella is somewhat concerned about a public backlash.

Clean energy

At first, the big players favoured clean energy options.

On a world scale, large data centres accounted for half of 2025 power purchase agreement (PPA) capacity.

In the Americas, large data centres represented 72% of clean energy procurement in 2025.  This often requires increasing the power capacity of existing infrastructure for generation and grid.  Many a time, the consequences are an increase in electricity rates and delays for closing coal plants for all in the area concerned.

For the Asia-Pacific region, data centres accounted for one-third of PPA capacity, while in the European, Middle East, African nations, the PPA power procured was one-eighth of capacity.

The exponential burst of U.S. construction projects for quick AI data centres has engendered a race to grab as much energy they can get to come on board quickly.

Installing renewable energy projects cannot keep up with the exceptional speed of data centre projects mushrooming across the U.S.

Since data centres operate 24/7, it is a challenge to have renewables meet the tasks, without cutting capacity for businesses and residential clients.

For Project Sail, Georgia Power announced a $16 billion expansion of 10 GW to its power capacity by 2030, two-thirds of its current capacity. The Trump administration will provide $26 billion loan to Southern Company, the parent firm of Georgia Power.

Georgia Power has tripled its decade long projection for power demand from 12 GW in 2025 to 36.5 GW.  Data centres are the source of 95% of increased demand.

Yet right now, data centres on average consume a minor share of a utility’s power, but it may reach 50% in 10 years.

Some data centres rely on their own centre-specific production of renewable energy

Google has invested in clean energy, more than private and public entities elsewhere in the world, to render some of its data centres self-sufficient.  Google has signed PPAs for wind and solar, co-locating renewables to connect with its data centres and spent $3 billion on rehabilitating aging hydroelectric dams in Pennsylvania.

Google will bring 2 GW of clean energy online in 2027-28.  This preempts utilities raising electricity rates to invest in infrastructure to accommodate data centres.

Google restarted a nuclear plant in Iowa under the umbrella of a 25-year PPA.

The Switch data centre south of the Las Vegas strip operates 100% with renewables, incredible for a centre that covers one square kilometre (mile).  It has a 1 GW solar field and is building more solar fields.

Nevada’s NV Energy requires that data centres fund their own energy needs but has no parameters for renewables.

Fossil fuels

The hic is such that regardless of well-intentioned environmental considerations, the sweltering momentum to build data centres ASAP, has got data centre giants focused on any source of energy to put energy supplies online quickly.

This is where fossil fuels come in.  Over half of the U.S. extraordinary demand will be accommodated by fossil fuels.  By 2035, these data centres will consume 106 GW of power, which is greater than the current installed capacity of hydro and nuclear in the U.S.

If present trends continue, U.S. emissions from generating so much electricity sourced with fossil fuels, that by 2028, the emissions would be equivalent to 10 million vehicles.

One of Trump’s favourite solutions includes the prolonging of the lifecycle of coal plants.

Though Google began with data centres with energy stemming from renewables, the company has mellowed their clean energy goals.

Google’s explanation on new emphasis on fossil fuels is that it is no longer “maintaining operational carbon neutrality”.

Google contracted for 2 methane-fired thermal generating plants. — one in Illinois and one in Nebraska — that would use carbon capture technology – a greenwashing solution.

Google has plans for an Armstrong Texas data centre campus which would be powered by a 933 MW methane thermal generating plant that will emit 4.5 million tonnes of CO2/year. That’s more than the 4 million tonnes emitted by San Francisco per year.

Meta, Amazon and Microsoft have plans for methane thermal power plants for their AI data centres.

Microsoft has entered an agreement with Chevron for a 2.5 GW gas power plant in Texas and another gas facility is planned for a West Virginia data centre.

Musk’s Colossus data centre in Memphis Tennessee is supplied by dozens of methane portable generators because Musk doesn’t have the time to wait for the local utility to meet his needs. Musk is seeking additional debt financing for Colossus 2 nearby, with energy furnished from a former gas plant.

ExxonMobil CEO Darren Woods assures that we need not worry about emissions because 90% of emissions can be captured and abated.

NextEra, serving a dozen states, concluded it cannot meet its net-zero goals for 2045.

NextEra explained that a carbon abated gas power plant at one data centre site in Southeast U.S. will be connected to Exxon’s CO2 pipeline network that encompasses Texas, Louisiana, and Mississippi.  Exxon would get a credit for this technology of $85/ton for any carbon captured.

Never mind that CCS NEVER meets goals for emission reductions, costs, and timelines.

Nevada had a goal of 50% clean energy capacity by 2030.  But the state cannot meet the power demands of planned data centres, triple the power consumed by Las Vegas, without turning towards fossil fuels.

For J.P. Morgan Asset Management strategist, Stephanie Aliaga, a few million tonnes of emissions would not stand in the way of AI’s major contributions to economic growth.

With the upcoming intensification of energy demand from data centres, North Carolina plans new gas plants and prolonging the “best before expiry” date of coal plants.

Orders for U.S. new gas plants are backlogged.

Mark Carney eyeing AI opportunities for gas exports

Mark Carney’s current Canadian government views America’s mounting needs for AI data centres as an opportunity and thus invited the U.S. to import more Canadian gas.  This is consistent with Carney’s “national interest” initiatives, exempt from existing legislation, favouring abandonment of Canada’s climate objectives, all with an emphasis on oil and gas, at the expense of action on climate change.

Also consistent, the Carney administration repealed the Clean Energy Regulation to open the door to the major Alberta gas company, Capital Power, for its intentions to build and supply a large AI centre in the province.  This is in addition to the Alberta government exempting a 7.5 GW data centre from an environmental evaluation.

With a similar perspective, the Canadian province of Saskatchewan welcomed data centre with a gas facility energy source just south of Regina.

The takeaway

Increased emissions, higher electricity rates, threatened water supplies, job losses to automation, overload of misinformation and/or the rupture of the small-town life are but some of the challenges posed by AI data centre proposals.

The U.S. accounts for 75% of global data centre capacity.  U.S. leadership stems largely from subsidized private debt for financing. The outstanding issue may be when, not if, the bubble will burst.

The majority of businesses are not significantly benefiting from AI in terms of productivity.

There is much AI slop,

AI is beneficial when there is credible training for machine learning.

But there aren’t any constraints on improper training, emissions and environmental degradation at-large.

The speed of development is primarily self-serving antisocial and/or out-of-control parameters which create albatrosses.  Accordingly, there are many AI systems capable of lying or misinforming while being whopping new sources of fossil fuel emissions.

Can governments regulate this?

India: Coal monopolizes, solar goals stymied

123rf

Renewables and Reality

In May 2025, India announced it has raised its renewables target of 500 gigawatts (GW) by 2030 to 900 GW. The Indian government claimed it is on track with 475 GW of installed renewables capacity in 2025, making it the world’s third-largest producer of wind and solar energy.

India’s Nationally Determined Contribution calls for 50% of the country’s energy requirements stemming from non-fossil fuels by 2030.

This where the narrative gets complex.  Renewables are underutilized.  Actual renewables power generation capacity is not reflected in the country’s power market share.

With many unsigned clean energy contracts, and a pipeline for many new renewables initiatives, between April 2024 and April 2025, only 30 GW of clean energy was installed, and coal still generated more than 75% of total output.

Energy Demand

Forecasts are such that India’s energy consumption will quadruple by 2047.

India’s power supply has increased 6% over the past decade while demand rose 5.6%.  This looks good, but this doesn’t consider dreadful heat waves caused by climate change.

Ultra extreme heat waves translating into high demand for electricity, especially for air-conditioning, can account for 50% of a household’s energy needs,

For India at-large, peak demand occurred at 250 GW in May 2024, an increase of 46 GW from the previous year.  This trend suggests energy demand could increase 50 to 80 GW by 2027. Despite India’s 2027 new capacity plan for 100 GW of renewables 28 GW of thermal and 13 GW of hydroelectric, this would still leave 20-40 GW of power shortages or about 8-12% as of 2026.

The good news is that solar costs are going down, so much, as to compete with coal.

Too, while thermal and hydroelectric plants have construction timelines of 5-8 years, solar projects can be completed in 1-2 years.

Coal remains on top of the power pyramid

In 2024, India’s power from coal and lignite thermal plants rose 5%, hitting a record of 1,357 billion kWh, up from 1,293 kWh in 2023.

Coal represents 79% of power sources and a 42% increase in coal production is planned for next 5 years.  The goal is to raise coal-fired power supply by 80 GW by FY 2031-32.

India has the second largest coal-fired fleet in the world at 240 GW of installed capacity.  In 2024, 100 GW of new coal-fired generation had been proposed or was under construction.

Fossil fuels has accounted for two-thirds of power capacity expansion.

Industry’s coal stakeholders reflect mixed signals.

Tata Power, India’s largest private power producer, had announced in 2021 that it would not be building any new coal plants.

In 2025, Tata divulged the construction of its first coal plant project in 6 years, since acquiring Prayagraj Power Generation Co Ltd (PPGCL) in 2019 through a joint venture.

Adani, one of the largest coal producers in India, in 2020, was a new player in the Indian solar market with the creation of Adani Green Energy Limited (AGEL).  AGEL aimed to have 25 GW of installed renewable energy by 2025.

In 2025, Adani power secured a $2 billion contract from the state-run Uttar Pradesh Power Corporation Ltd. for a 1,5 GW for a supper ultracritical coal power plant  Utter Pradesh estimated it will require 11 GW of thermal power by 2033-34.

Compounding the coal challenges, India is the world’s second largest producer of steel and the industry uses coal for steelmaking.  The steel sector relies on imports for its coking coal requirements.  Australian exports represented 53% of Indian coking coal supplies.

Though India has the fifth largest coal reserves in the world, it has to import coal to meet its needs!

Coal generation is projected to substantially increase until 2030 even if its share of installed capacity declines over this period.

India’s economy is expanding quickly while domestic coal is abundant and cheap, including low upfront costs.  India is the second-biggest coal consumer, behind China.

India relies on coal to improve the living standards of its population.

 Renewables Capacity and market share not the same

India is the third largest generator of solar power with more than 100 GW of capacity, behind China, the U.S.  This is quite the leap from 2014 when India only had 2.82 GW of solar capacity.

With solar prices continuing to decline, solar may appear to be taking on coal dominance in India, with a 100.33 GW of new capacity for FY 2024-25, up from 66.78 GW in FY 2022-23.

In the 2025 solar pipeline comprised 84 GW is under construction and 47.5 GW is out for tendering. Between 2018 and 2024, India added 113 GW of new power capacity, more than two-thirds from renewables, 88 GW, mostly solar coming in at 77 GW.

Why is it that between April 2024 and April 2025, 30 GW of clean energy was installed, but coal still generated more than three-quarters of total output.

Renewables use expansion is colossally impeded because India’s renewable energy sector has been experiencing many hurdles in 2025, including weak demand for tenders;land acquisition issues for projects; power agreement delays; grid integration complexities; minimal energy storage capacity; and project cancellations.

Especially noteworthy, the cost of capital for grid-scale renewable energy in India is 80% higher than in advanced economies, though low compared to emerging and developing economies.  The latter impacts on real and perceived risks for projects.

If matters would be going according to the national government’s plan, coal would represent 55% of India’s power market by 2030.  But will this be the case?

Renewables haven’t replaced coal, rather it has supplemented the power supply to keep pace with increasing electricity demand.

True, wind has progressed slowly, now representing 10.3% of the country’s capacity.

India is trying to incentivize solar tech manufacturing with its National Manufacturing Mission introduced in 2023.  The program has supported 48 GW of module manufacturing capacity.

One of the incentive success stories on solar tech domestic manufacturing is that of Tata Power’ s subsidiary, TP Solar.  TP Solar has a 4.3-GW solar cell and module manufacturing facility in the state of Tamil Nadu in southeast India.  This is the largest such facility in India.

Another beneficiary of the national program is Jupiter Renewables with a $231 million cell and module plants with production capacities of 4.2 GW and 3.6 GW respectively.

Most of the new projects planned support rural economic growth including job creation.

Energy Storage

India is barely implementing energy storage policies, energy storage being a nascent solution at this point.

Shortfalls can be avoided in the immediate future should India install and utilize 50 GW of new solar capacity with 15-30 GW of energy storage.

Unfortunately, only 4.86 GW of energy storage capacity was in place in India in December 2024.

India obviously needs to put its weight behind standalone energy storage systems. (SESS)

Accordingly India put out 11 tenders for 6.1 GW of SESS in Q1 2025.    This capacity surpassed energy storage tenders in 2024.  An incentive in the form of Viability Gap Funding (VGF) offers 30% support for standalone battery ESS capital expenditures.

Persistent execution and commercial bottlenecks have sabotaged the tenders and new funding.  Delays and cancellations of power sale and storage agreements, often associated with falling battery prices, are major obstructions.

Other barriers are inadequate battery supply chains, manufacturing and financing.  Battery cell manufacturing capacity is limited and depends on imported lithium and cobalt.  Refining and commercialization timelines and affordable financing constitute further roadblocks.

No wonder, awarded capacity of 6.4 GW had been cancelled.

With both solar and storage costs declining rapidly, moving quickly on combined solar and energy storage capacity is the rationale option.

While battery manufacturing and supply chains in India manufacturing leaves much to be desired, global battery manufacturing overcapacity will keep battery energy storage system (BESS) prices low until 2030.  More than enough low-cost BESS are on the market to meet India’s immediate needs.

Energy storage capacity in India in December 2024 was merely 4.86 GW.  For 500 GW of renewables capacity, India would require 364 GW of solar and 121 GW of wind, necessitating 73.93 GW/411.4 GWh of storage capacity.

India’s Ministry of Power issued energy storage guidelines which will be mandatory for future solar projects, but does not apply to existing solar installations.   This advisory applies to all power distribution companies and renewable energy implementing agencies (REIAs) to have a minimum of 2-hour located energy storage systems equivalent to 10% of solar capacity installed for all future projects.  The intention is to both address intermittence from solar sources plus electricity prices to ensure reliability of grid supply and reduce dependence on peak hour sources.

Distribution licences would include storage capacity guidelines for rooftop solar as well.

The takeaway

Should India be able to align renewables capacity targets with power market share, this would be a good news story.

Multiple bureaucratic, project and private sector cognitive dissonance impede renewables from having impacts such that coal would no longer occupy over 75% of power output.

Renewables have not replaced coal, rather it has contributed to the extraordinary additional power India requires for its needs.

These challenges are compounded by failure to beef up energy storage capacity to maximize the delivery of power from intermittent renewable energy sources.

Too many problems to solve, the renewables political hype doesn’t deliver.

Should India miraculously overcome the obstacles for a green transition, the country would concurrently become energy self-sufficient and tackle climate change.

That India is in second place as a global leader in solar power installed capacity is obviously insufficient.

COP29: China, Trump and the EU, each own way: Green vs. stranded fossil assets

Update Dec. 5, 2024 Chart of cargo containers with Chinese, US and European Union flags

For climate action, China has chosen long-term extraordinary innovation investments and scale to wean off fossil fuels.

The European Union (EU) is making progress for energy independence by 2027, though with some Chinese technologies.

Too, the UK and Brazil have set ambitious climate targets

The U.S., Trump administration will enhance paths towards stranded fossil fuel assets. The private sector will continue floundering on clean tech innovation and base performance on the short-term, quarterly reports.

Canada will emulate the U.S.

China

China spent $676 billion on clean tech in 2023, over double that of any other nation.

The good news is that China’s power emissions may peak by 2025, ahead of its 2030 target and the first annual decline since 2016. Should China succeed in plateauing emissions in 2025, the Paris Agreement target to halve emissions by 2030, could have been a possibility, if it weren’t from Trump.

This potential appears unimaginable since China accounted for 30% of global emissions in 2022, 11 billion tonnes.

China’s 2024 drop in annual emissions is anticipated to be about 7.2% or 8.2%.

The bad news are potential impacts on economies outside China regarding their clean tech manufacturers competing with much more affordable and more advanced Chinese exports.

There appears to be a pattern for China’s clean tech successes, high up front government support for research and development plus oversupplying the domestic Chinese market.  This formula has had mixed consequences.

China’s oversupply of clean tech industry typically achieves excellent economies of scale for offering low prices, but often results in profit declines, or even losing money, due to fierce competition in the domestic market.

To make up for the domestic low margins, prices for Chinese export markets are set to be both profitable and affordable choices in these markets.

European Union

The European Union, post Russian invasion of Ukraine, like China, has an agenda to sever dependence on fossil fuels. The EU aims for energy independence via a green transition by 2027.

While there was a 911-like spike in LNG imports from the U.S. immediately after the invasion, thanks to intensive emphasis on renewables, heat pumps, efficiency and other measures, EU gas imports were down 20% in 2023 and anticipated to peak by 2025.

Electric vehicle (EV) sales trends indicate a displacement in European oil consumption of 3.3 million barrels/day by 2030.

U.S. and Canada

Trump promised to pull out of the Paris Agreement.

Though the Inflation Reduction Act (IRA) and Bipartisan Infrastructure Law (BIL) have been outstanding in supporting the building of clean tech factories, EV purchases and the installation of home energy saving solutions, e.g. heat pumps, and solar panels, Trump wants to water down these milestone laws to suit his agenda.

Nonetheless, Trump will have to take into account that in 2023 the clean energy sector, including storage and EV charging, came in at 40% of U.S. energy jobs, with a 200% growth in that year.

The EV and battery projects announced and associated with the Inflation Reduction Act and Bipartisan Infrastructure Law will create of 201,900 jobs.  This sector could generate another 931,000 jobs.

Still, since the U.S. innovation gap with China widened even with the original IRA and BIL in place, expect that gap to grow when Trump unbelievably dilutes the legislation.

Trump referred government backing of the green economy as a “green new scam.”

Further contributing to the innovation gap, emission standards across all sectors will become more lenient.

Most notably, the overriding energy themes will be in “drill, baby drill,” for increasing oil and gas production.

What will Trump do when global fossil fuel demand peaks and U.S. clean tech jobs outnumber oil industry employment?

Sadly, Canada will follow in U.S., as always, and continue to be a fossil fuel exporting nation.  The next likely Prime Minister, Pierre Poiliève, will make sure of that.

UK and Brazil step up at COP29

At COP29, the UK pledged to reduce emissions by 81% by 2035 from 1990 levels and Brazil has prepared a comprehensive climate plan for a 59% to 67% GHG reduction by 2035 based on 2005 levels.

Electric Vehicles and batteries

China’s dominance in affordable electric vehicle (EV) and battery sectors are prominent examples of technological leadership and the Chinese oversupply business models.

At first glance, one might get the impression that China is an unlikely leader in these sectors.

Compared to Western economies, China has considerably fewer cars, vans, buses, freight and other trucks per 1,000 inhabitants at 231, very low compared to the U.S. 908; Canada 790; Germany 628; and  U.K. 600.

In part, low vehicle ownership in China is a consequence of being the global leader public transit. China has 46,000 km of high-speed rail, 50 subway systems with over 10,000 km of track, substantial light rail and had 455,000 e-buses on its roads in 2022.

Yet, with EVs having reached 53% of the Chinese vehicle market in September 2024, China represented 69% of the global EV registrations in 2024, up until October.  That’s because Chinese EVs are considerably more affordable than EVs in other countries.

China’s EV tech lead goes back to the 1990’s when China started to invest in EV research.  Back then, China had realized Chinese manufacturers of internal combustion engine vehicle (ICEV) models could not compete in export markets that are too overcrowded with competitors.

Thereupon, China developed a complex compilation of measures that pushed manufacturers towards producing New Energy Vehicles (EVs), the consequences being manufacturing of ICEVs became more expensive to produce and EVs less expensive.

Today, additional more compelling contributing factors to Chinese affordable EVs and batteries include government support for quickly getting over the time hump to get a return on investment. Overall, China’s EV financing covers innovation, development, minimizing production costs and start-ups.

China’s holistic long term vision has been a key to reducing EV battery costs.  China has invested more on battery research than all other nations combined and has a plethora of EV R & D programs.

Unimageable in Western economies, China’s CATL, the largest battery producer in the world, has 20,000 employees dedicated to R & D.

BYD, the largest EV manufacturer in China and second biggest battery producer, is a rare integrated EV and battery firm making most parts in-house.  These achievements are thanks to its 900,000 employees, of which more than 110,000 are R & D staff.

By early 2022, China accounted for 80 percent of global battery production capacity and controls, 75% of battery cell manufacturing, 90% of anode and electrolyte production, 60% of battery component manufacturing, and refining for more than half of global lithium, cobalt and graphite.

The battery technology-related savings have manifested into 95% of Chinese made EVs equipped with the less costly lithium iron phosphate (LFP) batteries.  LFP batteries are nearly exclusively manufactured in China.

Outside China, NMC batteries (lithium-nickel-manganese-cobalt-oxide) are typically used.

Compared to the NMC batteries, LFP batteries are cheaper to manufacture, have higher stability and are easier to recycle.

However, on performance, LFP batteries are not yet as good as lithium-ion ones.  But technological advances are in the process of closing the performance gap.

CATL and BYD alone, have 90% of the LFP market.

The results are battery costs are about 18% less in China than elsewhere.  This is critical for the pricing of an EV since the battery typically comes in at 40% of an EV’s cost.

However, until now, China’s LFP batteries have been destined for the more affordable entry level small low- to mid-cost models.

Hyundai is about to change all that, challenging China’s LFP cartel with an ultra-high capacity 300 Wh/kg LFP battery to be produced without Chinese components by end 2025.  Average Chinese LFP battery capacity is 200 Wh/kg.

If Hyundai succeeds in its LFP development plan, it will have a LFP battery with longer range than the typical NMC battery and would be the first LFP battery for high performance EVs.

If all goes according to plan, Hyundai may be able to produce affordable EVs with LFP batteries for both entry level and performance models, with impressive range and not subject to tariff barriers.

Also in progress, BYD is constructing a factory for third generation batteries, sodium-ion batteries, for scooters and micro vehicles, for starters.  BYD believes it could eventually produce sodium-ion batteries that will be less than the cost of LFP in the long term.

CATL is working on its improved new enhanced version of sodium-ion batteries for small and short range vehicles and China’s Chery will have a factory for the fourth generation, solid-state batteries.

As well, China’s EVs benefit from better economies of scale associated with oversupplying. Chinese EV manufacturers bet attractive pricing will create demand to meet supply.  Oversupply may be an understatement as China’s 200 EV manufacturers will have launched about 110 EV models by end 2024.  With all the competition, the average domestic profit margin is slim, averaging 5% in 2023, with some models sold below cost.

As indicated above, the profits are made on exports, while still maintaining a price advantage.  The BYD lineup average price is $30,000.

While the U.S. and Canada have imposed 100% tariffs on Chinese EVs, BYD is entering a new foreign market nearly every week, launches about 10 new models/year, and has an operating manufacturing plant in Thailand, plus facility projects in Mexico, Hungary, Turkey, Brazil and Indonesia.

These are important considerations, since the revenues of legacy automakers depend on global markets, not North America alone.

Legacy EV and battery manufacturers outside Asia cannot compete with the scale, pace of innovation and/or vertical integration of their Asian competitors.

Legacy firms depend on a plethora of external suppliers.

All the more for making the future of Western legacy automakers uncertain.

Tariffs and other barriers to affordable EVs

The U.S. and Canada 100% tariffs on China’s EVs, batteries and components will boomerang regarding a growing innovation gap and legacy automakers’ competitivity in critical global markets.

Not bothered by the United States-Mexico-Canada Agreement on trade, Biden and Trump intend to keep Chinese EVs made in Mexico out of the U.S.

Since the U.S. also has a trade agreements with Morocco and South Korea, many Chinese EV components investors had been planning to build plants in these countries.

A Trump reworking of the Inflation Reduction Act and Bipartisan Infrastructure Law, upon which the Moroccan and South Korean projects are premised, may see the aforementioned investments put on pause.

The Biden administration has already implied that Chinese EVs manufactured elsewhere would not be eligible for $7,500 consumer credit applicable to North American built vehicles.

Trump may put the final nail on this escape route.

The Trump additional 25% import tariffs for all goods from Canada and Mexico might apply to Canadian EVs and batteries too.

Contrasting the U.S. an Canada, the European Union has manufacturer-specific trade barriers on Chinese EVs, the EU varying tariffs range from 8% to 35%, on top of an existing 10% duty.  The highest tariff is aimed at SAIC Motor Corp, likely because the company is state-owned.

The EU doesn’t want to set the tariffs too high because the EU hopes to attract China’s manufacturers to invest in factories in the EU.  Production of Chinese EVs in Europe would remove tariffs and many Chinese EV manufactures are doing just that.

In addition to the BYD EV plants planned for Hungary and Turkey, other Chinese EV stakeholders, such as Geely vehicles and CATL, are engaged in major investments in Europe.

Even with the EU tariffs, many Chinese EV imports will still be somewhat more affordable than their European competitors.

The European Commission (EC) concluded that the average Chinese EV battery electric vehicle (BEV) imports cost 32% less than European EVs in 2023.

The 2024 prognosis is that China’s EV imports will come in at 25% of the European EV market share.

A large portion of these imports are Tesla, Dacia and BMW EVs.

Legacy automakers

The China advantage spells trouble for EVs produced by legacy automakers.

Battery projects in Western economies may be outdated before production begins.

Better technology and better prices cannot be stifled by protectionism.

Many legacy automakers have not gotten over the hump for a return on investment.

In June 2024, Ford claimed it loses $100,000 for every EV sold, its EV division lost $4.7 billion in 2023 and expected losses to hit $5.5 billion in 2024.  Thus, Ford plans to offer more of the more profitable plug-in hybrids.

Meanwhile, GM is mumbling about offering different battery chemistries and enlarging its plug-in hybrid lineup.

Volkswagen, the largest German employer with 10 factories in the country, is experiencing economic troubles too and looking to plug-in hybrids as the way forward.

In late October 2024, Volkswagen announced it will be shutting down 3 plants in Germany and cut wages by 10% for 140,000 employees.

Among other things, Volkswagen cited a drop in third quarter 2024 profit levels by 42% associated with lower then projected, or insufficient, EV sales, to recover the high EV transition costs; increased competition from European EV imports from China; and sharp declines in the Volkswagen market in China, where EV sales now exceed ICEVs.

Since traditionally 40% of Volkswagen sales have been in China, the deterioration of the Volkswagen market in China constitutes a heavy blow for the company.

Likewise, BMW and Mercedes Benz are dependent on the Chinese market, for 32% of global sales and 28% respectively.

This puts Volkswagen, Mercedes Benz and BMW in a conundrum.

Germany opposed EU tariffs on EV imports from China.

Oversupply in renewables

China is determined to reduce its dependence on fossil fuel imports while Trump aims to increase oil and gas production.

Accordingly, the China clean tech oversupply business model applies to the solar panel, and wind turbine sectors.

In the China’s wind sector, production overcapacity during 2022 and 2023 brought about low domestic market profit margins, while in the U.S. and Europe, the margins were 2 to 3 times higher.

Consequently, the Chinese turbines prices in Europe and the U.S. were lower than their European and U.S. competitors.  Six of the 10 top windpower producers are Chinese.

For solar panels, despite China’s mindboggling increases in the annual solar installation rate, China’s solar manufacturers were caught with an oversupply having exceeded China’s storage and transmission capacity.

In the coming two years, the Chinese solar modules manufacturing capacity may actually double world demand.

As is the case with the Chinese EV sector, excessive renewables competition within China has led to unprofitably low domestic prices, compensated by exports of more profitable and affordable exports.

Trump’s proposed 20% tariffs on all solar and wind imports from China could affect the prices of renewables in the U.S.

The takeaway

China, the EU, the UK and Brazil will accelerate weaning off fossil fuels, leaving the U.S., and Canada too, to increase the production of these fuels as the market for these fuels dwindles.

China will persist in manufacturing more clean tech, solar, wind, EVs, batteries/storage, plus electrifying its industries at levels greater than the rest of the world combined.

For the U.S., action on climate change to compete with China, will take inconceivable huge hits with Trump, while fossil fuel production will be administered steroids.  The U.S. clean tech private sector will continue to lag on innovation, constrained by an investment community which only understands  quarterly reports.  The U.S. will continue to lose ground on clean tech leadership.

Canada has much to lose, especially with Conservative Pierre Poiliève, the likely next Prime Minister, aligned with Trump on denial of climate change, increasing oil and gas production and many other issues.

The EU seeks win-win formulae with rational environmental and economic considerations.  The EU may show the way forward.

China, the EU, UK and Brazil will stand out as global climate leaders.

China green shift global impact greater than COP

Expectations for COP29 in Azerbaijan, based COP28 in the United Arab Emirates?

The light getting in though the cracks is few countries are immune to competition with China’s sweeping expeditious green transition.

China’s brisk energy transition intentions are three-fold, decarbonization of its economy, domination of global clean tech manufacturing and reduced dependence on imported fossil fuels.

Renewables

The COP28 final statement calls for a tripling of renewables capacity by 2030.  China had an objective to triple renewables capacity by 2030 too, but China will reach its 2030 renewables capacity target in 2025, 1,2 TW (terawatts). The country will continue to increase capacity sharply thereafter.  By 2030, the forecast is for China is to hit 3.9 TW.  The aforementioned COP28 global ambition was for 11 TW by the end of the decade.

According to the IEA, China now accounts for 60% of global renewables capacity installed in 2023 and this will carry over into 2024.  The expansion of capacity is outpacing rising demand.  For 2023, China investments in renewables will attain the summit of US$177 billion.

For 2023, BloombergNEF projected China solar capacity additions to reach 208 gigawatts (GW), twice the entire U.S. solar capacity.

China’s new wind and solar capacity installations for 2023 may amount to 300 GW, astronomical compared to the global capacity increase of 338 GW in 2022.

By September 2023, total installed wind and solar capacity was 400 GW and 520 GW, respectively.  To put this in perspective, Hydro-Québec, one of the largest utility companies in North America, has a total production capacity of 47.5 GW.

All together, China is installing 20 GW of wind and solar per month.

By the third quarter of 2023, 53% of China’s power sources were wind, solar, hydro and nuclear.  That’s a giant leap from 2011 when coal accounted for 80% of the country’s power supply.

The scale of some of the renewables projects is staggering.  The Golmud Solar Park in Qinghai, the world’s largest solar park, has a capacity of 2.8 GW with 7 million solar panels spread over sands.  Even that is just the beginning.  The plan calls for expanding this park 6-fold in the next 5 years.

In 2022, plans were announced for 500 GW of onshore solar and offshore wind projects for Gobi Desert across Xinjiang, Inner Mongolia, and Gansu provinces.

To transport gargantuan new capacity, ultrahigh-voltage (UHV) lines projects are eye-popping.  State Grid Corp of China, the country’s largest State-owned utility, has started construction on 13 UHV lines covering 30,000 km.

China catapults economy-wide electrification

China is electrifying its economy at a mind-boggling rate, with 1.1 million electric buses and trucks; two-thirds of the global market for light EVs; electric subways and light rail; and 42,000 km of electric high speed passenger and freight rail.

Consequently, China’s Sinopec, a large petroleum refiner and distributor, anticipates peak gasoline will occur in 2023.

Coal

China’s electric power carbon emissions will peak in 2023 or 2024, ahead of the 2030 target, plateau for a while, and then enter an exponential decline.  This is attributable to mindboggling increases in renewables capacity, and an uptake in hydro capacity.

True, China has the world’s largest coal power plant fleet.  Yet, the opening of 2 coal plants per week or 106 GW of new power plants in 2022, responds to peaking requirements only.  While China reached 1,100 GW of coal power plants functioning in 2022, 775 GW of operational coal plants were shut down or were projects that never made it to construction.

Consequently, coal plants in China on average run 50% of the time.  Carbon Tracker has divulged that 40% of China’s coal plants are losing money.  The 5 major state-owned coal power plant companies are also experiencing heavy losses.

The capacity usage will fall further to 25% over the next two decades.

These contradictions are largely the result of provincial governments supporting their local coal enterprises and jobs.

A forthcoming plateau in infrastructure projects translates into less coal for cement production, a 2.7% reduction in 2023 and 61% reduction by 2036.  Likewise, petrochemical and aluminium production drops will contribute to lower demand for coal.

These factors should result in a decline in coal demand by 2024, as alluded above.  Not only many coal plants permitted up to 2023 will never get built, but also many existing coal plants will become stranded assets.

In China, likewise for Europe and India, 90% of coal plants will be uncompetitive by 2025.

EVs

The BloombergNEF Electric Vehicle Outlook 2023 reported that EV growth rates for 2022 were 62% world-wide and 95% in China.

In 2022, China had 600,000 electric buses on the road, at least 99% of the world total.  That year, it manufactured 138,000 e-buses for the domestic market.

There were 400,000 electric trucks on China’s roads in 2022.

China’s rate of light-duty EV growth is 4 times that of the U.S.  Total EVs sold in China are greater than in the rest of the world.  For the end of 2023, it is projected plug-ins will have reached 38% of sales.

Too, China is now the world’s largest exporter of EVs.  For 2022, exports from China acquired 11% of the European market.  An irony of sorts, Tesla’s Shanghai factory is China’s largest EV exporter.

North America is vulnerable to an invasion of EVs from China too.  China’s BYD will soon launch the BYD Seal in North America to compete with the Tesla Model 3.  Other Chinese EV brands are planning international expansion.  By contrast, North American EV and battery investments related to the U.S. Inflation Reduction Act and Canada’s Budget 2023 await production start-up dates.

Fascinating is the electrification of the three-wheelers for which China and India account for 90% of the global fleet.   There were 117 million 3-wheelers on the roads in the world by 2022, 70% of which were electric, though most with lead-acid batteries.  That jumps to 300 million if two-wheelers are included.

The 3-wheeler sales in 2022 were over 12 million units encompassing a major migration to lithium-ion batteries.  For the short-term, it is the two- to three-wheelers that will generate a noticeable decline in oil consumption.

The global share of EVs in two- and three-wheeler sales increased from 34% in 2015 to 49% in 2022.

Clean tech manufacturing

China has 9 of the 13 largest solar manufacturers in the world and 7 of the top 10 global wind manufacturers are in China.

Solar panels production was 310 GW in 2022; were about 500 GW for 2023; and 1000 GW in 2025, the latter 4 times the output worldwide.

Energy storage battery capacity to accommodate intermittent renewables power will go from 550 GWh in 2022; to 800 GWh in 2023, and 3,000 GWh in 2025.

By early 2022, China accounted for 80 percent of global battery production capacity.

China had 125 battery factories in 2022 and more than double are in the planning or construction phases  This despite, China having only 10% of lithium raw material, while Australia has 50%.

Lower battery prices give China an EV edge in global markets.  The average price of a Chinese EV battery is US$26,500.  That is one third of the transaction price in Europe and half that of the U.S.

An astonishing next generation battery head start is that of China’s BYD breaking ground in January 2024 for the first sodium-ion gigafactory, a technology still in the development stage for most. Sodium-ion batteries are composed of abundant iron and sodium, free the more expensive lithium plus nickel, cobalt and graphite.  This technology replaces lithium cathode material and can be combined with hard carbon anode.  It is less vulnerable to cold weather.  BYD will initially use these batteries for scooters and micro-vehicles.

Also, China’s leadership comprises a long-term view, having issued rules that all battery powered vehicle manufacturers must be responsible for battery recycling.  The policy also directs that the design of batteries facilitates recycling.  China is experimenting with a battery recycling framework.

Decarbonization

By far, China dominates global industrial production, 61% of global steelmaking, 57% aluminium manufacturing and 52% cement output, collectively more than half of global production.  The chemical and paper sectors represent 40% of the global share in these sectors.

China’s wide array of state-owned enterprises (SOEs) are pillars for backing a decarbonization goal under the umbrella of China’s 14th 5-year plan.  Under this plan, carbon neutrality will be accomplished by 2060, CO2 emissions will peak by 2030 and 50% of increased energy consumption will stem from renewables by 2025.

As for energy SOEs, they are immune to the straitjacket of oil and gas companies, incapable of changing their increased fossil fuel trajectories.   In this regard, SOEs are diversifying their portfolios, with a strong push for renewables and massively investing in research and development and innovation of clean technologies.

Belt and Road Initiative (BRI)

BRI is by far the most ambitious global economic development program involving over 115 countries.

From 2013 to 2022, fossil fuel infrastructure accounted for two-thirds of BRI power sector investments.

In September 2021, China announced it will not support new coal plants abroad, though not all new coal projects were shut down.

China has since established the BRI International Green Development Coalition with 134 international partners.  UN Environment will facilitate BRI recipients to achieve UN Sustainable Development Goals including green finance and energy, plus energy efficiency.

For the first half of 2023, 56% of the US$12.3 billion in BRI energy investments were allotted to renewables.  Colour coded prioritization of projects favours green ones. 

At COP29 in Azerbaijan, November 2024, China let it be known that since 2016, it invested $24 billion in developing countries.

China emissions to-date 

There are those who suggest China must act first before their own countries take action on climate change and China is addicted to coal.  China is acting first, leaving no excuses for the climate naysayers.

Granted, China emitted 31% of global emissions, 11,397 metric tonnes (Mt) in 2022.  This is more than twice as much as the U.S. for 2022 at 13.6%, with 5057 Mt.

This does not tell all.  On a per capita basis, China’s emissions are half that of the U.S.  Since 1751, China is responsible for  half the cumulative emissions as the U.S.

But this is history, China is migrating into a green transition quicker than most can assimilate.

The takeaway

The U.S.$369 billion Inflation Reduction Act (IRA) which is spurring a tsunami of investments in clean tech plus manufacturing of EVs and batteries is largely about closing the green economy gap with China.  One year after the IRA passage, in August 2023, private sector investment announcements in U.S. clean tech projects totaled up to US$278 billion and 170,000 jobs.

The domino effect on the European Union is such that it is exploring how to close the clean tech investment gap with the U.S.  The EU “lost” its solar industry in favour of China, European wind manufacturers are struggling to compete with lower cost Chinese turbines and 11% of the European EV market is represented by Chinese imports.

China’s march to dominate the green economy suggest a green transition will become a global competition imperative.

China will change the course of the global energy geopolitical titanic.

By contrast, the exclusion of reducing fossil fuel production in the COP28 final statement is not a milestone.

Big Oil, renewables, electric vehicles + clean tech: Fossil fuel windfalls

Wind, solar, storage + electric vehicle

Prior to the Russian barbaric invasion in Ukraine, announcements made by the oil and gas majors seemed to imply they were engaged in energy diversification.  This diversification has been typically presented as that of increasing the proportion of their assets in clean technologies while reducing the exploitation of fossil fuel reserves.

Now, with the oil and gas companies earning windfall profits linked to the Ukraine war, inflation and European urgent short-term requirements for fossil fuel sources substitutes, the real truth is coming out.  High fuel prices have revealed opportunist short term thinking prevails over lofty long-term goals.

China: Largest emitter to green gamechanger, but…

China climate emergency global influence

China is several years ahead of other developed countries on the migration to a green economy, in clean technology production capacity, massive market penetration and green investments. China already has an extraordinary global green export potential. China leads in renewables, electric vehicles and battery production, incrementally regulating plastic solutions, high-speed rail, private clean tech investment, government environmental support and green bonds.  China’s concurrent climate actions are gamechangers destined to have huge global competition impacts on energy, economic, transportation, industrial and other paradigms, perhaps more so than the climate crisis.  But there are simultaneous contradictions. China is the world’s largest liquified natural gas importer, once again ramping up coal production and certainly not a leader on human rights.

Putin losing energy war: European climate emergency

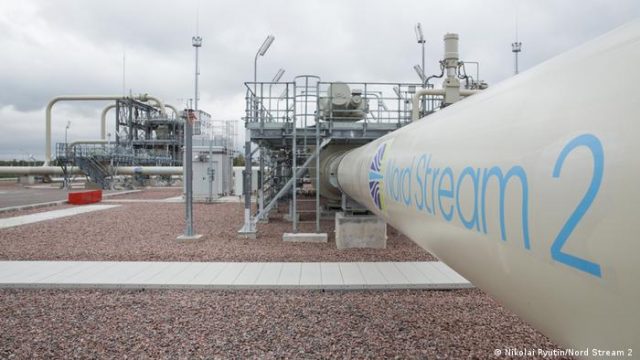
Nord Stream 2 gas pipeline padlocked

Putin’s war has created an electroshock for Europe because it depends on fossil fuel imports for 60% of its energy, one-third of which comes from Russia.  Organically evolving European Union (EU) plans target 2027 for a massive and rapid transition to a green economy and energy independence.  Renewables, electric vehicles, clean technologies and energy efficiency will all play major roles in the creation of fast-forward paradigms for global emulation.  For the immediate, by the end of 2022, EU plans entail cutting Russia gas imports by two-thirds, substitution fuel sources plus ramping up renewables and energy efficiency.  These EU plans will be devastating for the Russian economy.  Russia needs European oil and gas revenues more than Europe needs these fuels.

Green hydrogen, no panacea: Deep dive

Green hydrogen offshore wind powered

Green hydrogen, produced with electrolysers to separate hydrogen from water, uses clean energy as a power source.  Green hydrogen will not be with cost competitive with grey hydrogen for some time, perhaps not until 2030.  Grey hydrogen, derived from steam reformation of natural gas, represents 98 percent of global hydrogen consumption, and is primarily used for industrial processes.  To replace grey hydrogen with green hydrogen would require a doubling of global electricity generation with primarily solar and wind sources.  This would pre-empt the use of renewables for electrical power, with energy losses totaling up to 75% when green hydrogen is reconverted into electricity!  The result would be more use of natural gas for power production.  And there are extraordinary inefficiencies and technological challenges for green hydrogen use, while there is no shortage of affordable and efficient clean technologies alternatives.  Nevertheless, US$30 billion has been committed to-date for green hydrogen through government stimulus packages.  Is green hydrogen a fossil fuel industry trojan horse for gas derived hydrogen and the use of gas for electrical power?

Shipping sustainability: Oxymoron but paradigm to change

Container ship powered by dirty oil, updated April 27, 2023

Cargo and cruise ships represent 2.6 percent of global emissions and could reach 17 percent by 2050.  Nearly all these ships use cheap dirty heavy oil with high sulphur content.   International regulations aren’t helpful as they are lax and difficult to enforce.  Fortunately, Maersk, the largest container shipping company in the world, has created the conditions for an industry-wide sectoral revolution by setting 2040 as a target to achieve net-zero emissions, requiring all new vessel acquisitions be carbon-neutral and has already ordered 12 green methanol powered ships.  Concurrently, many new technological solutions are under development including ones associated with electric, wind and biofuel energy sources.  Stringent territorial waters and docking standards, Maersk technological catalysts, financing of emerging remedies, could advance clean technologies quickly.  Finally, open-loop scrubbers are widely used as a band-aid to remove sulphur from the exhausts to transfer the pollutants into the sea.

Investing responsibly, in the Canadian green economy, not easy: Policy solutions

Canada compares poorly in buttressing clean tech firms.

Reliable standards for environmentally sound investments do not exist and very few Canadian clean tech firms are listed on a stock exchange.  Too often, Canadian clean tech firms must go outside Canada for financial support and/or to enter the stock market.  This article presents solutions for investors and clean tech companies alike, but these solutions require government action. 

Green economy: Financial sector zigzags

Green financing improves but has a long way to go

BlackRock, the world’s largest investment firm, has indicated that those that don’t tackle climate change will lose money in 5 years. Some financial institutions have made multi-trillion commitments from now to 2030 to invest in the green economy while still focusing the majority of investments in fossil fuels. Canadian banks are among the global top fossil fuel investors.

Fossil fuel sector contrasts: Green transition engaged, but not enough

Not all fossil fuel companies the same

Not all Big Oil firms are alike. Some are engaged in a rapid green migration, many are sitting on the fence and others are still in climate denial. Meanwhile, the value of fossil fuel assets are declining but the industry is camouflaging this by selling assets and debt financing to keep shareholders happy.

Green jobs see huge growth globally: Why is Canada missing out?

There are those like Stephen Harper who repeatedly say we must choose between economic development and sustainable development.

And there are those who, concerned about the environment and the latest reports from the International Panel on Climate Change, suggest that economic development and sustainable development should be reconciled.  Countries such as Germany are often cited as cases in point.  Most environmental organizations fall into this latter reconciliation category.

China’s chaotic leap forward to a green economy

When most people talk of China and its environmental and energy challenges, they tend to paint a very bleak picture.  While this view is historically justified, things are changing fast in today’s China.

Criticism of China’s environmental record has been traditionally well-justified. After all, China:  1) displaced the US as the world’s largest energy consumer as of 2009 – doubling its energy consumption between 2000 and 2009; 2) produces the world’s  highest pollution levels, with 16 of the top 20 most-polluted cities in the world being in China; and 3) now has total annual vehicle sales higher than that of the US.

Canada’s Green Economy needs public investment

Both the Intergovernmental Panel and Climate Change and the International Energy Agency have concluded that public policies, rather than the availability of resources, are among the key determinants for a shift from fossil fuels to clean technology development and deployment.  Public banks are critical agents for change along these lines.

Public financial institutions and the green economy around the world

Starting with some of the largest public banks, in July 2013, both the World Bank and the European Investment Bank announced that they will limit to the bare minimum investments in fossil fuel projects, while shifting the lion’s share of their respective energy investments to renewables.